The Business Problem
What makes a TV show last 30+ years? The Simpsons is not just a cultural phenomenon — it is a data problem. Viewership has fluctuated dramatically across seasons, critical reception has shifted, and yet the show keeps running. The goal of this project was to find the patterns behind its enduring success and identify what actually drives episode performance.
Approach & Technical Execution
This was a 3-week group project covering the full analytics pipeline, from dataset generation to visual storytelling.
Project management — Scrum Master role: I led the team as Scrum Master, applying Agile methodologies throughout the project lifecycle. This included running daily stand-ups to track progress and surface blockers early, defining and monitoring delivery timelines across phases, and supervising deliverables at each stage — from data cleaning through to final presentation. The 3-week timeline was met in full.
AI-driven dataset enrichment: One of the distinguishing features of this project was the use of AI models to generate and enrich the dataset — filling gaps in episode metadata and enabling analysis across variables not available in standard public datasets.
Exploratory Data Analysis: Python (Pandas, NumPy) for data cleaning, feature engineering and statistical analysis across 30+ seasons of episode data — ratings, viewership, writers, directors and guest appearances.
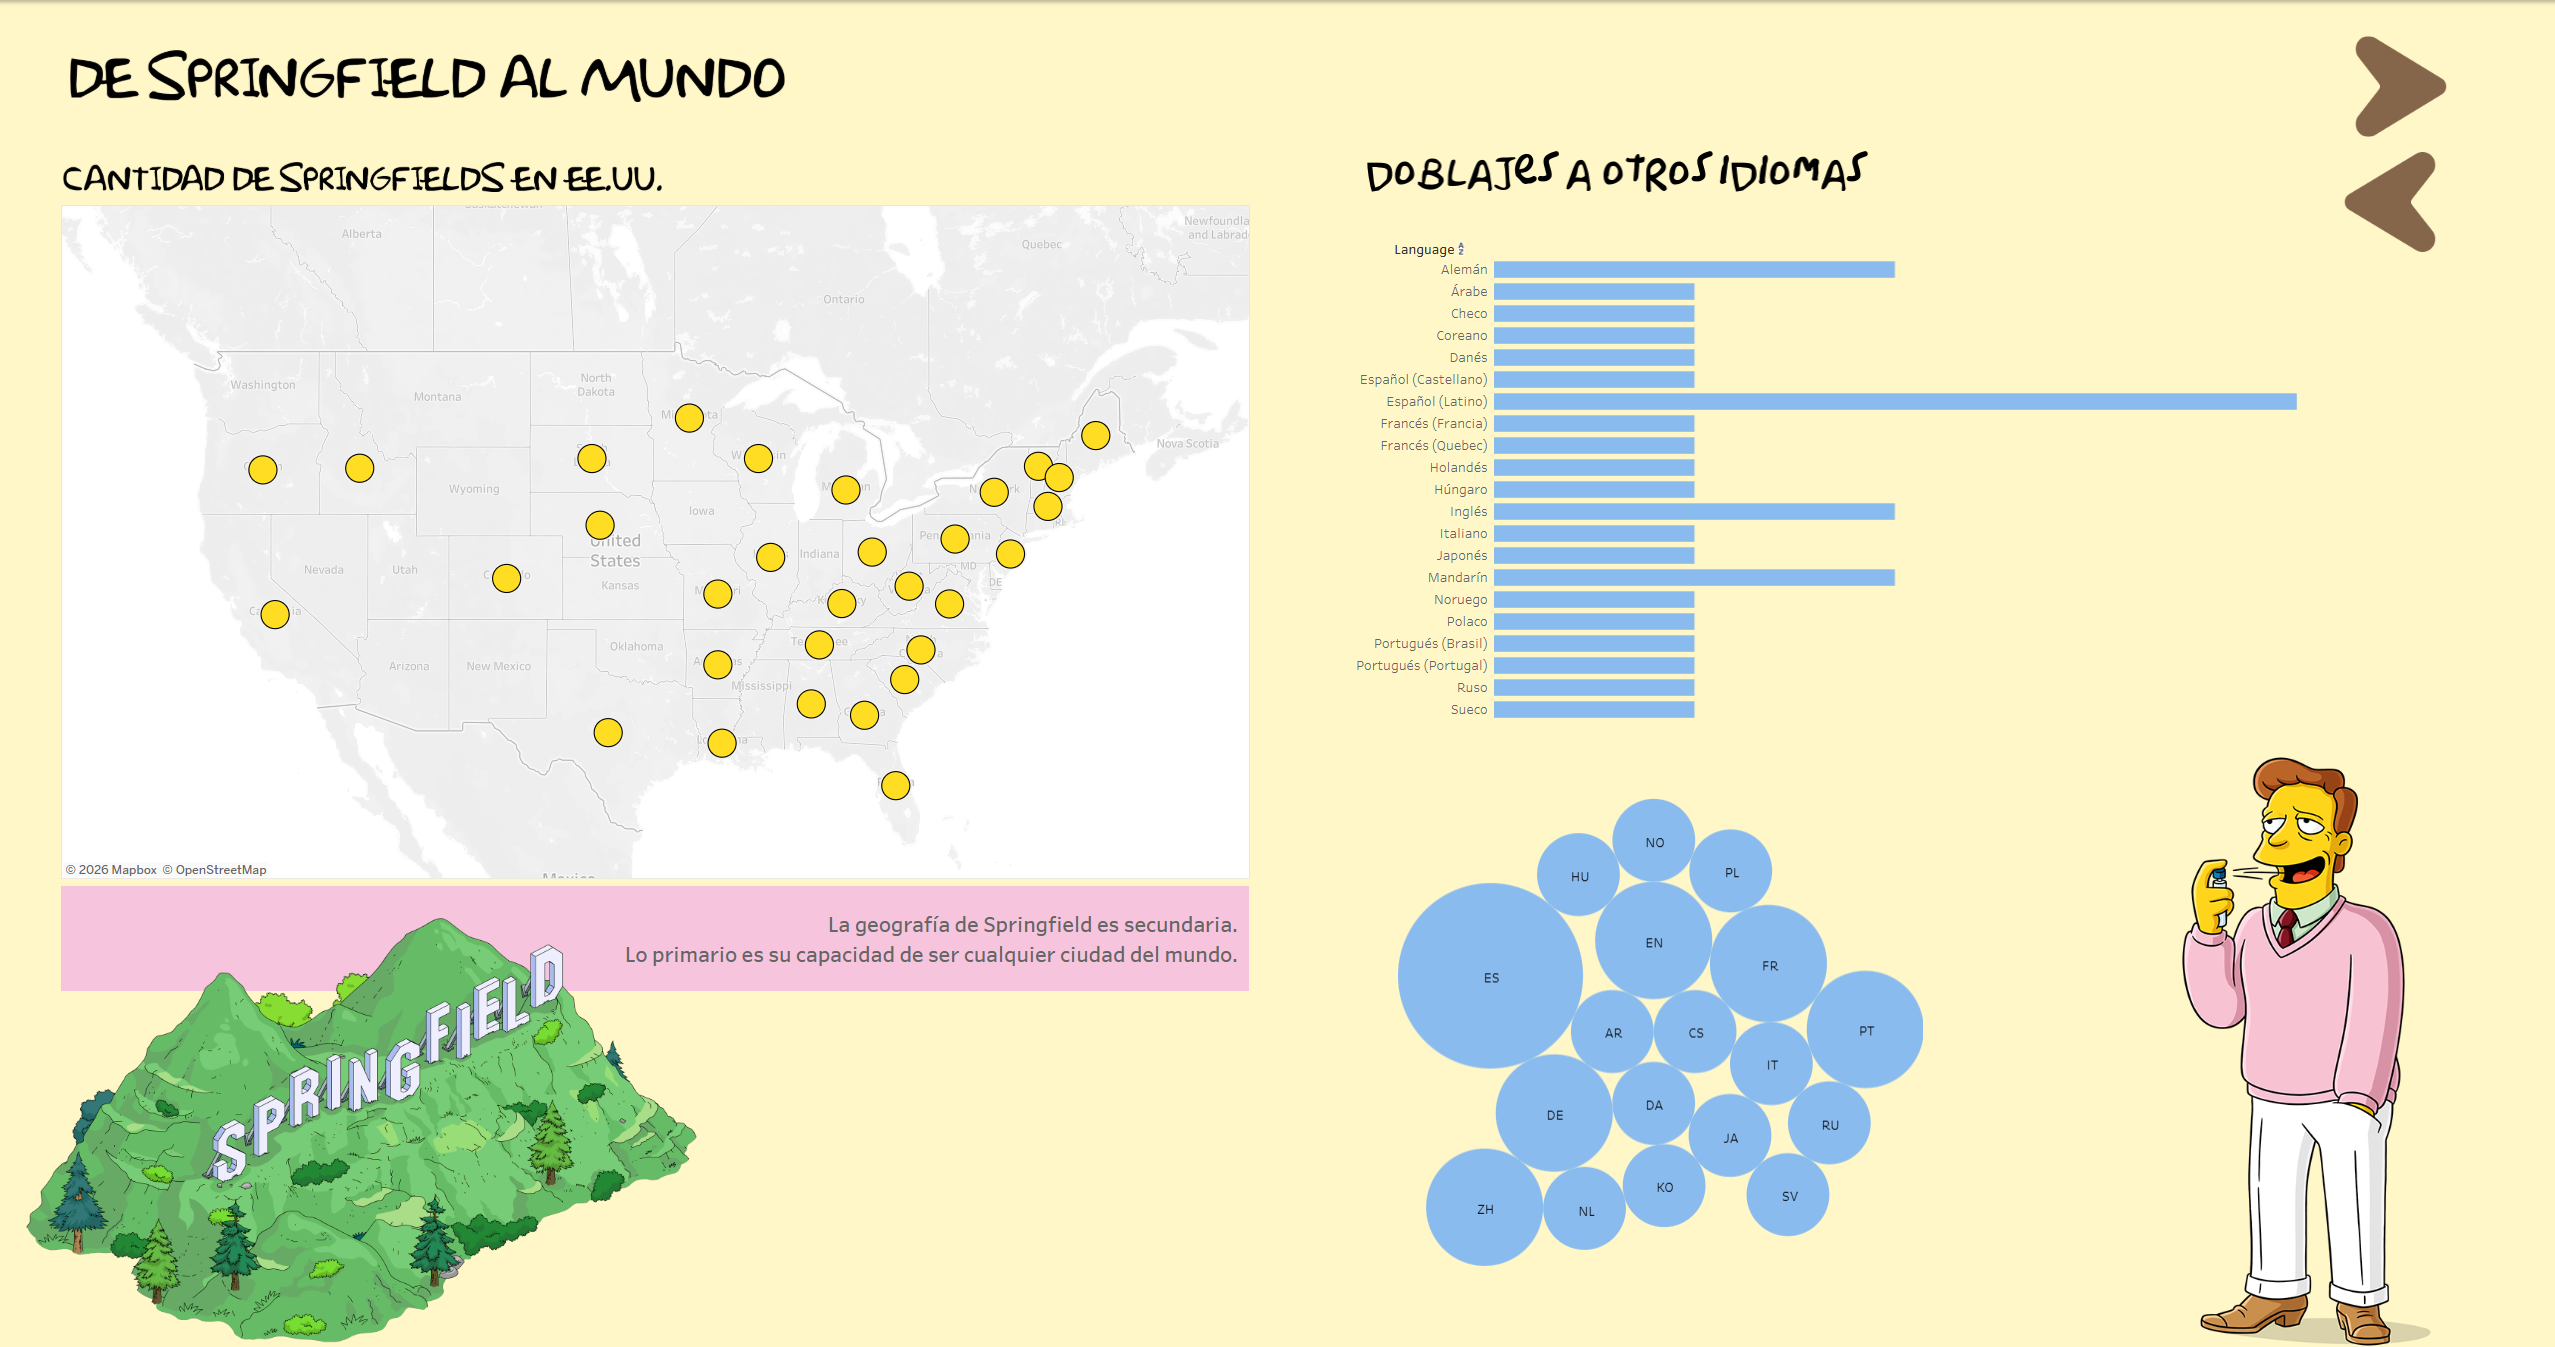
Visualisation: Charts and dashboards designed to communicate findings clearly to a non-technical audience, translating season-level trends into actionable narrative.
Key Findings
The analysis identified several non-obvious drivers of episode success:
- Writer consistency correlates more strongly with ratings than guest appearances — contrary to the common assumption that celebrity cameos drive viewership.
- Viewership decline is structural, not content-driven — the drop mirrors broader linear TV trends and accelerates post-streaming era, regardless of episode quality.
- The highest-rated episodes cluster in seasons 3–10, with a measurable shift in writing style and episode length that coincides with the rating peak.
What This Project Demonstrates
Beyond the technical execution, this project is an example of data storytelling applied to a real cultural dataset — taking 30 years of messy, incomplete data and building a coherent narrative that answers a genuine business question: what makes content last?
It also demonstrates the ability to manage a technical team under time pressure — coordinating deliverables, keeping the project on track, and ensuring every phase was completed to standard.
Stack
Python Pandas NumPy AI Dataset Enrichment Data Visualisation EDA