The Business Problem
Employee turnover is one of the most expensive and preventable challenges organisations face. The goal of this project was to go beyond surface-level churn rates and identify why people leave — and which roles and conditions carry the highest risk.
The question wasn’t just “who is leaving?” but “what is the organisation doing — or not doing — that is driving them out?”
Approach & Technical Execution
This was an end-to-end project completed in 3 weeks in group, covering the full analytics pipeline:
Data processing: Python (Pandas, NumPy) for data cleaning, feature engineering, and exploratory analysis. SQL queries to validate data integrity and cross-reference behavioural patterns across employee segments.
Analysis: Descriptive statistics and correlation analysis to identify the variables most strongly associated with attrition — with a focus on overtime hours, compensation levels, and role classification.
Visualisation: Interactive Power BI dashboard (DAX, Power Query) designed for executive consumption — translating complex multivariate findings into actionable visual narratives.
Key Findings
The analysis surfaced three structural drivers of attrition that are often overlooked in standard HR reporting:
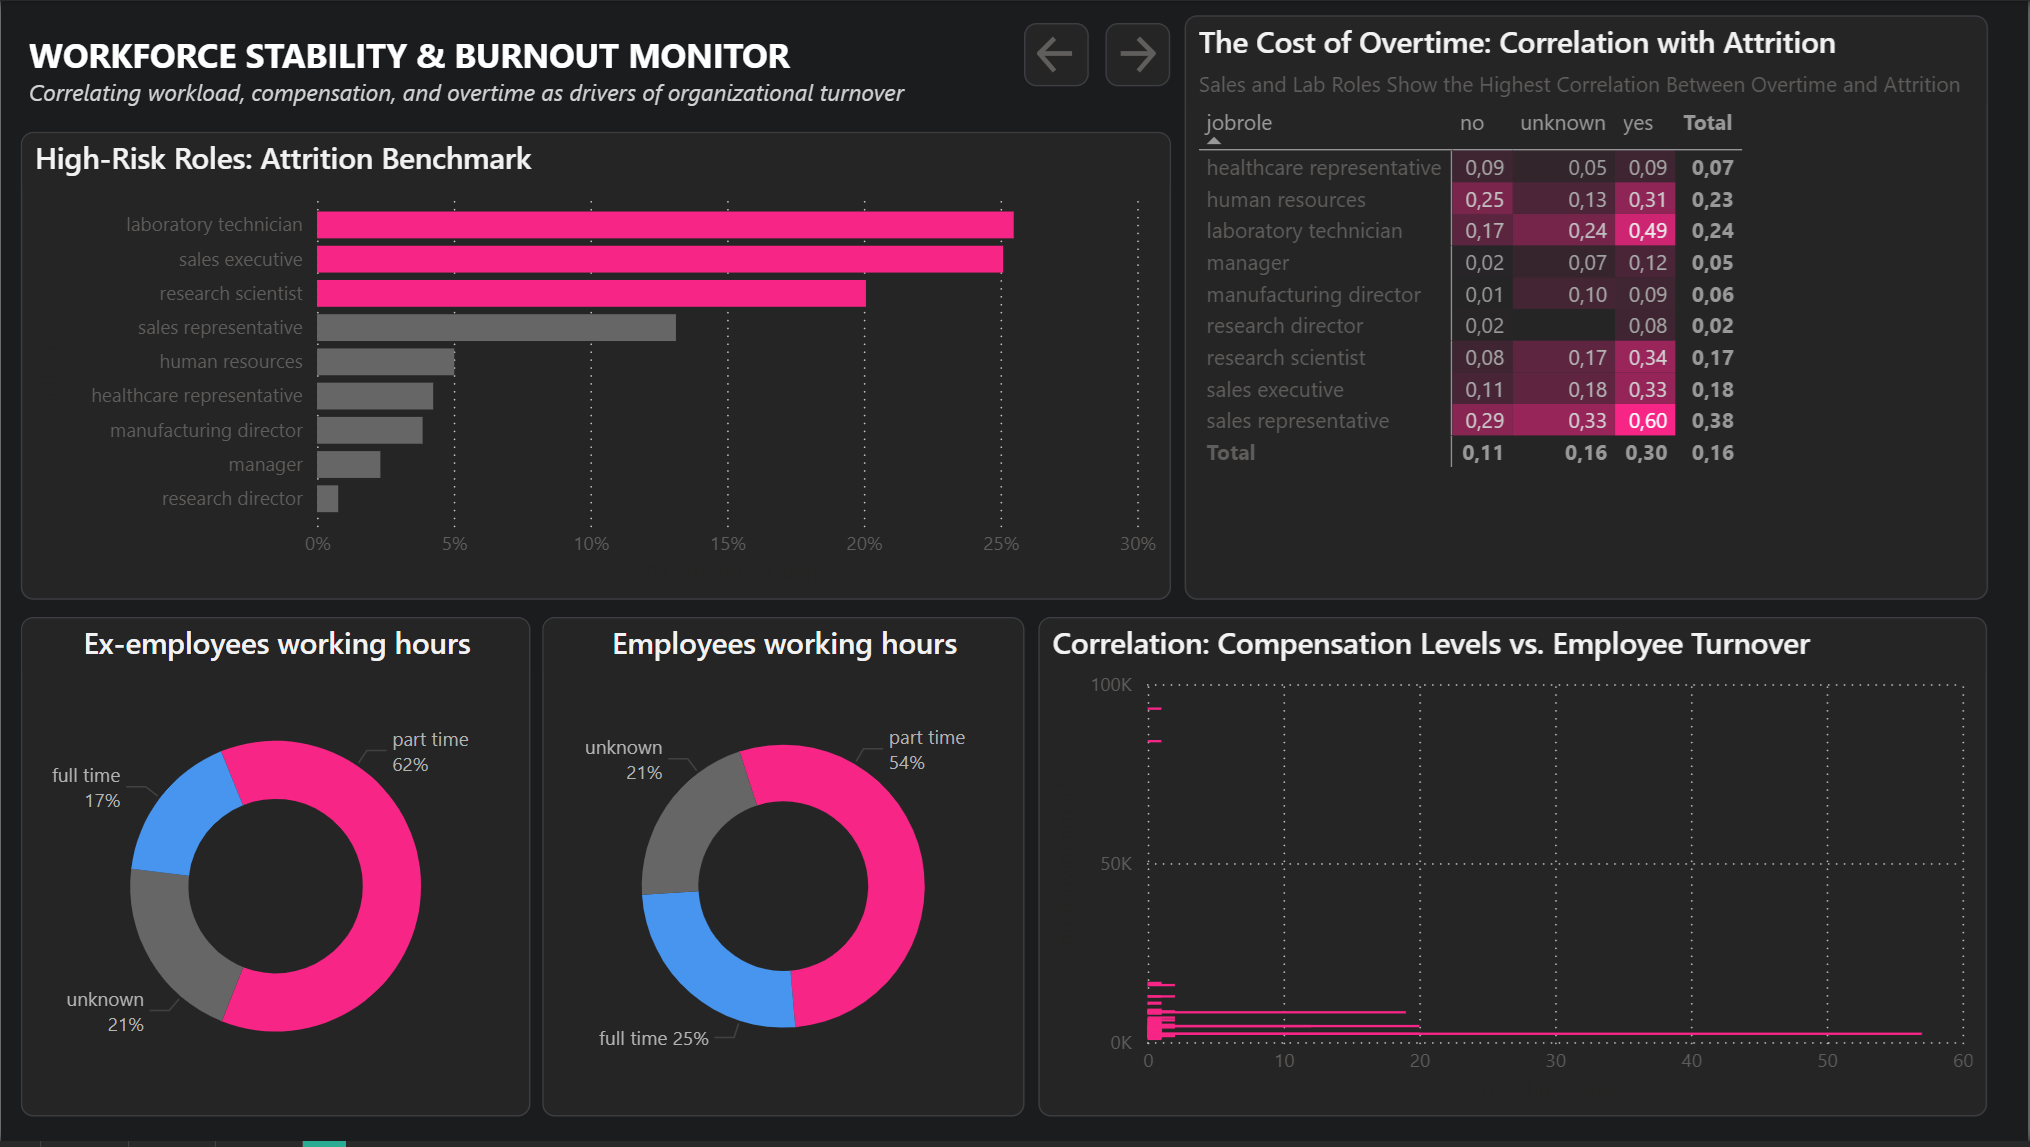
- Overtime is the strongest predictor of churn in high-skill roles. Sales representatives showed a 0.60 attrition correlation with overtime — the highest across all roles. Laboratory technicians and research scientists followed closely.
- Part-time ex-employees represent 62% of churned staff, suggesting that non-standard contracts correlate with lower retention — a finding with direct implications for workforce planning.
- Compensation alone does not predict turnover. The scatter analysis showed no clear linear relationship between salary levels and attrition, challenging the assumption that pay rises are the primary retention lever.
Output
A multi-page interactive Power BI dashboard — the Workforce Stability & Burnout Monitor — designed to give HR leadership a role-by-role attrition benchmark, with drill-down capability by working hours, contract type, and compensation band.
The dashboard was built to answer the question any leadership team needs answered before making retention investments: where is the risk concentrated, and what is actually driving it?
Stack
Python Pandas NumPy SQL Power BI DAX Power Query